Two predefined reports over live data: Sales for enquiries and conversion, Financial for revenue and what is owed. There is no formula builder and no cube to configure. The numbers are the ones the console already keeps, cut by a period, a date basis and three filters.
Open reports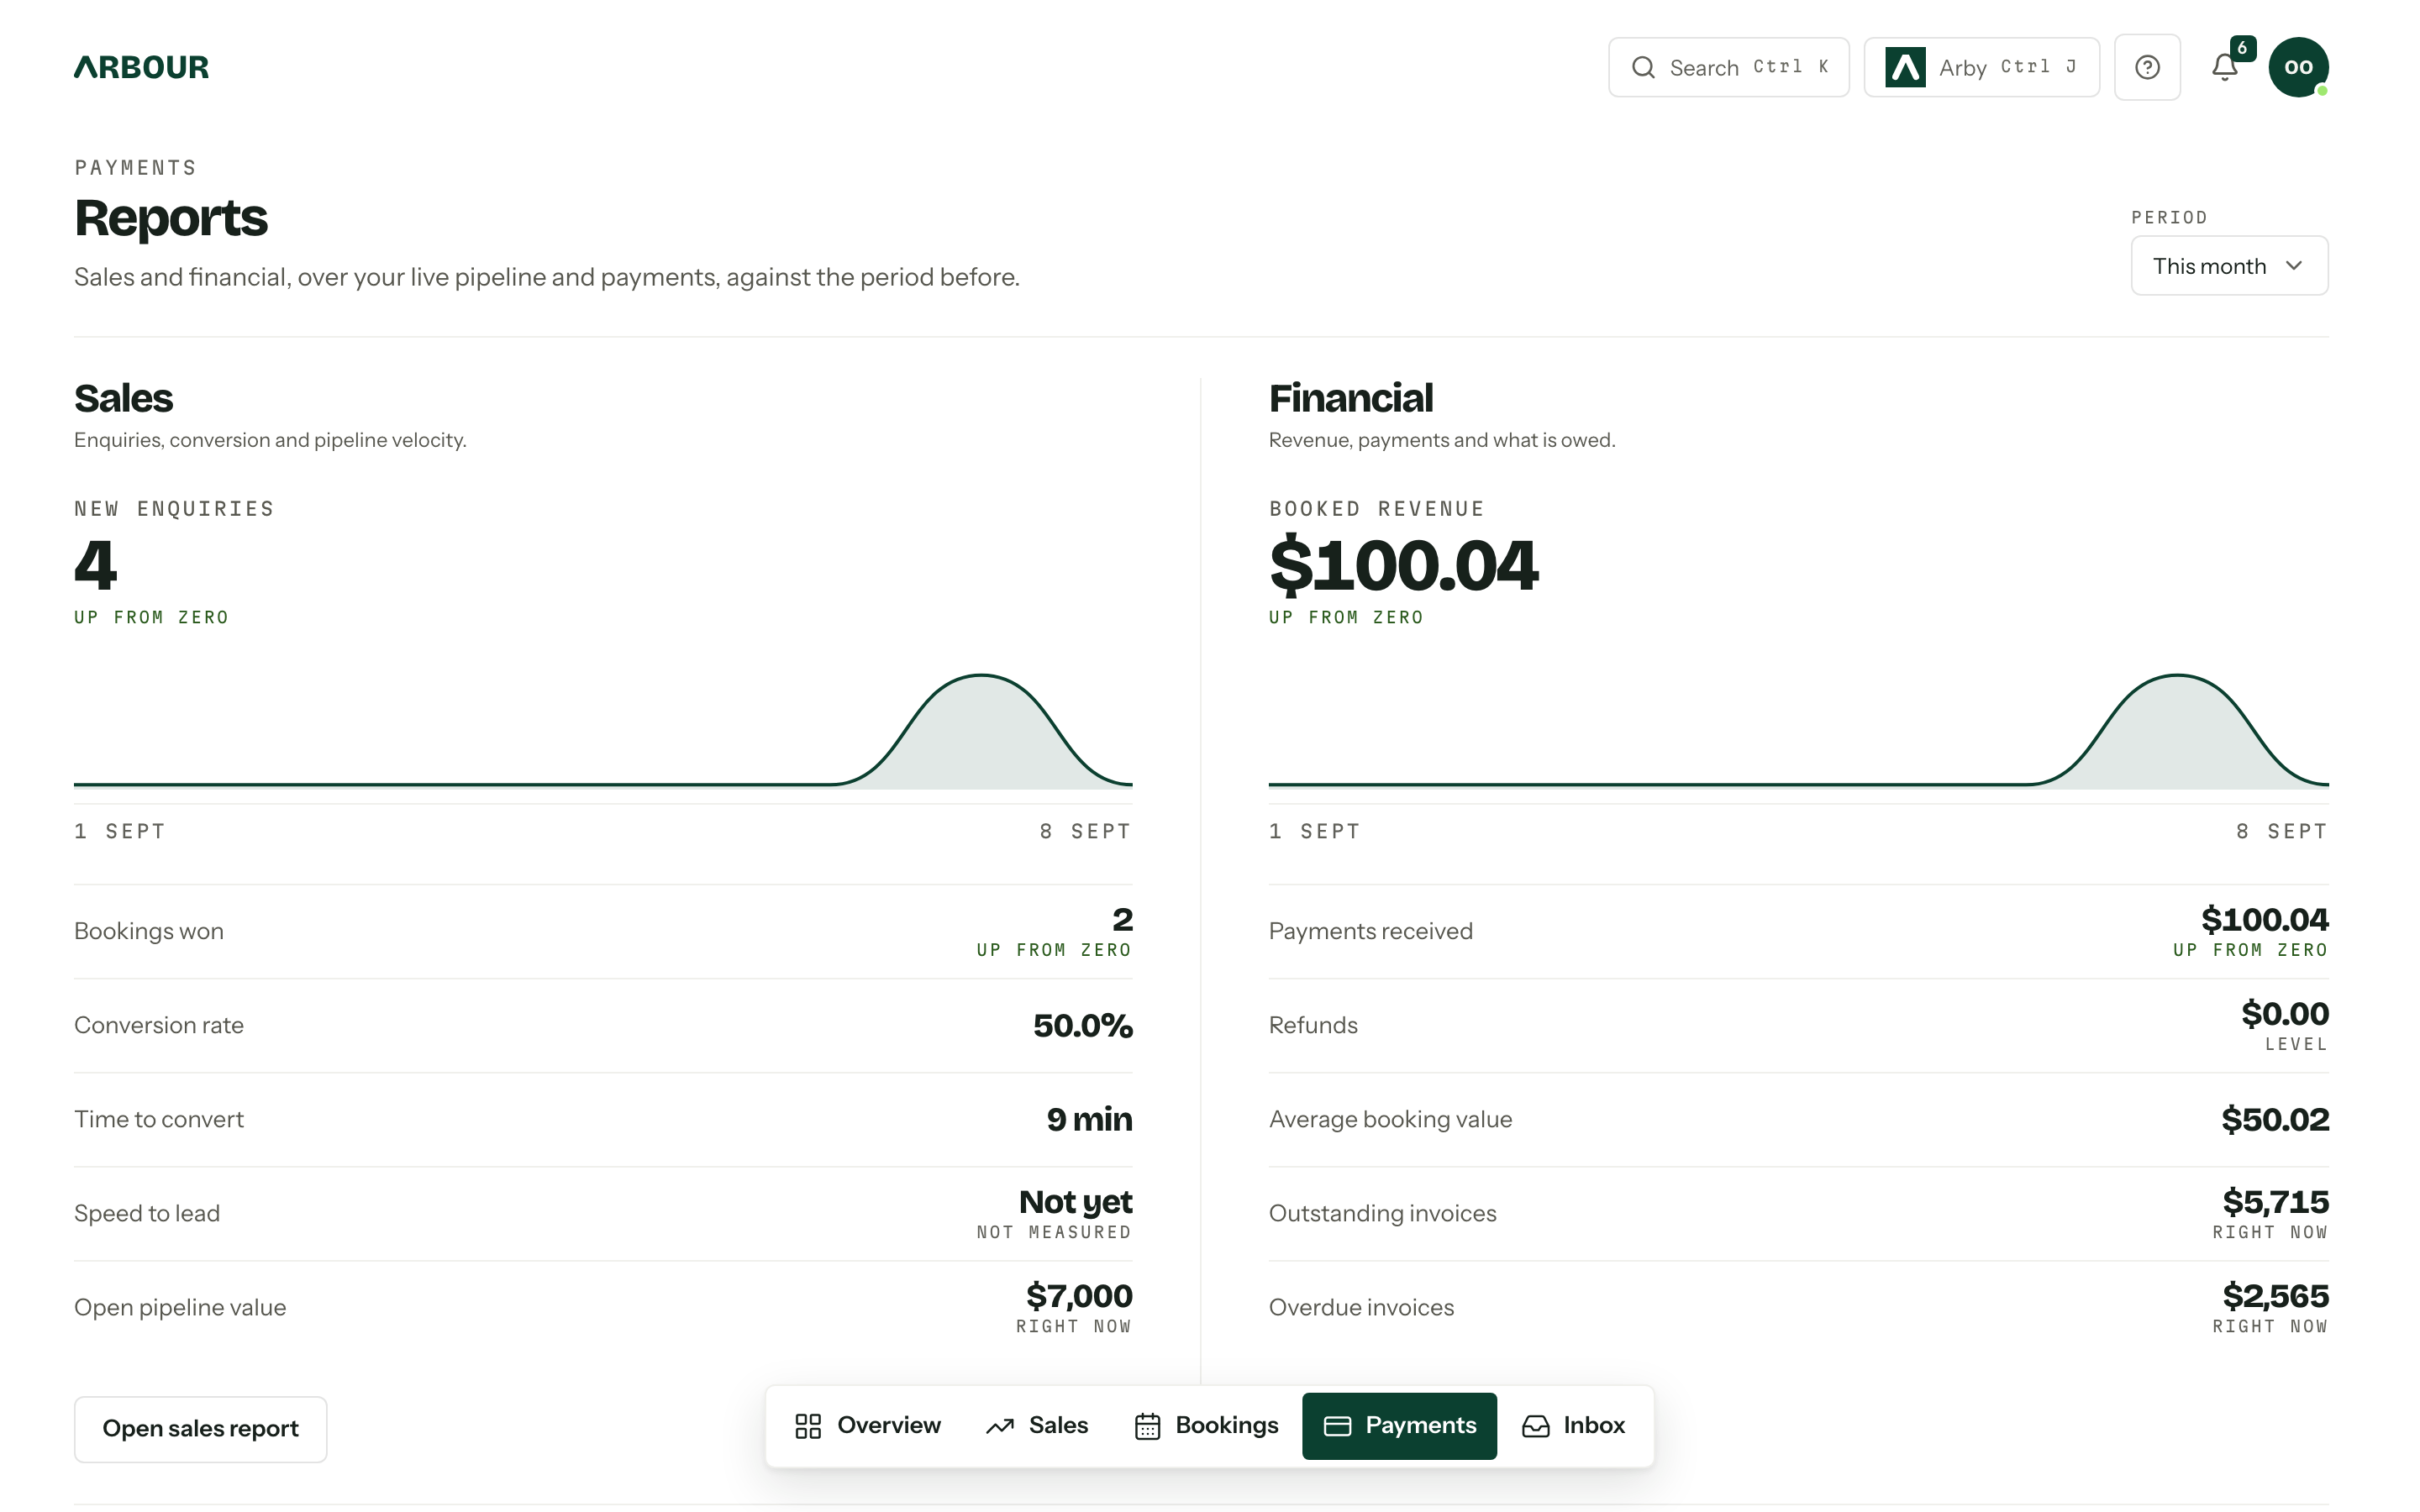
Period, basis and filters
Every report page carries the same row of controls.
Period takes a preset (this month, this quarter, this calendar year, this financial year, rolling 12 months) or Custom dates, up to three years wide. Presets run to today rather than to the end of the period, so a part-finished month is compared against the same number of days just before it, never against a whole one.
Attribute by is the one people miss. Booked date counts a booking on the day the sale landed. Event date counts it on the day of the job itself. A March wedding sold in August is one row, in two different months, depending on which question you are asking. It only moves the metrics it can move: enquiry counts do not have two dates.
Compare with offers the previous period, the previous year or nothing at all, and drives the up and down chips beside each figure. Point-in-time figures like outstanding invoices never compare, because there is nothing to compare them with.
The three filters are Lead source, Package and Stage, and they apply across the whole page at once.
Sales
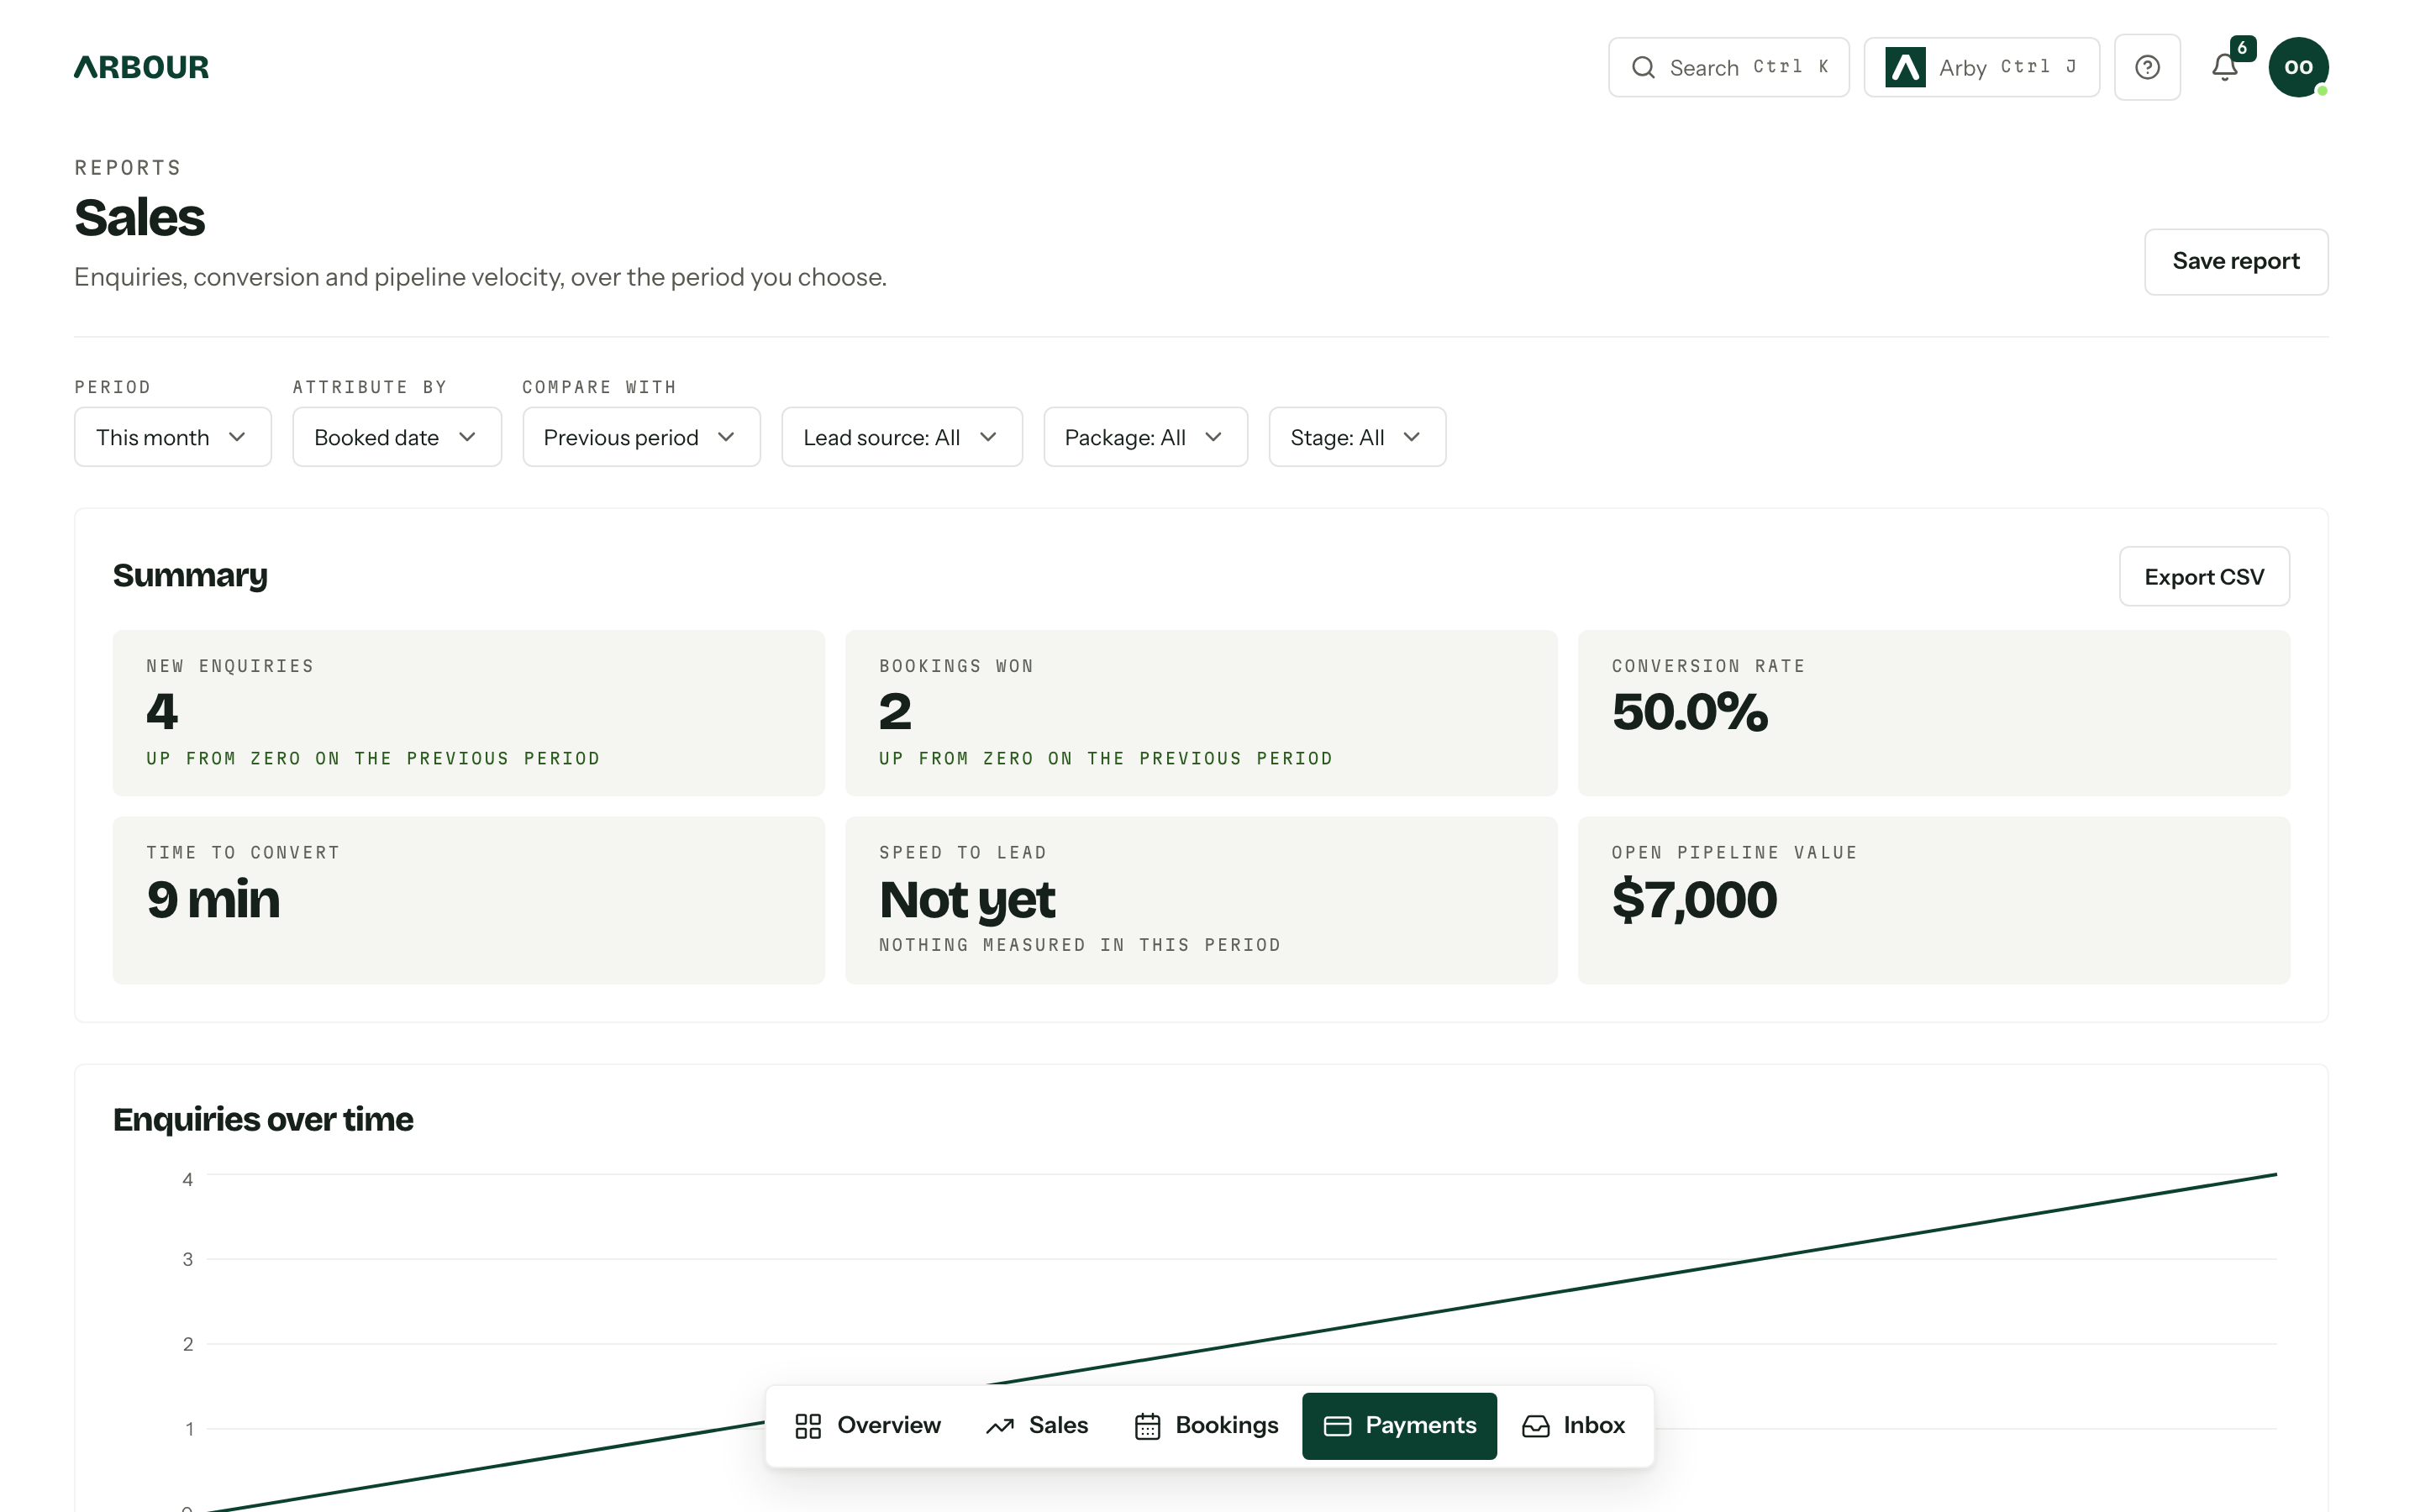
The summary covers new enquiries, bookings won, conversion rate, time to convert, speed to lead and open pipeline value. Conversion is cohort based: of the enquiries created in the period, the share that have converted since. Speed to lead is the median time from a new enquiry to your first reply or logged call, which is the number most worth watching.
Below it: enquiries over time by week, a snapshot of where work is sitting by stage, how long items have been in each stage, then breakdowns of enquiries and bookings by source and bookings by package.
Financial
Booked revenue, payments received, refunds, average booking value, outstanding invoices and overdue invoices. Revenue and payments are plotted by month, then broken down by package and by source.
Two of those are current state rather than period totals. Outstanding is the unpaid remainder across issued invoices right now; overdue is the part of that already past its due date. Refunds use the date each refund occurred, so a refund in September appears in September even if the payment arrived earlier. Historical refunds with unknown dates are excluded from period totals.
Saving and exporting
Save report stores the whole control set under a name. Saved reports are yours alone and appear on the reports page, where they can be reopened, renamed or deleted. Opening one from there prefills the controls; change anything and you are offered saving over it or saving as new.
Export CSV on any card downloads that table exactly as configured, comparison included.
Who can see them
Reports need View analytics and reports. Because a report totals every enquiry and every payment, that permission cannot be held alone: a role holding it must also be able to view pipeline items, view all of them, and view invoices and payments. The role editor enforces that in both directions. Without it the pages load and say so instead of showing figures. See Team and roles.
The tiles on the Overview run on the same metrics. Edit there lets you add, arrange and configure them per person.